By admin 22 November 2017
Understanding Venn-Diagrams for Scoring Well in SSC Exam
Quantitative Aptitude, Reasoning Ability, English Comprehension and General Awareness are a few common topics covered in bank and SSC exams, out of which Reasoning section is the one that is most scoring. However you must note that this section is not easy and requires a smart approach.
In SSC exam, reasoning covers 4 to 5 questions and these questions aim at testing candidate’s ability to classify certain items or groups. If an aspirant has practised enough with such questions, he/she can easily score well. One of the most important topics under reasoning is ‘Venn Diagram’. In this blog we will cover some of the important concepts of ‘Venn Diagram’. For an in-depth understanding of the concept of Venn diagram and you must enrol for our SSC online coaching tutorials.
What is a Venn-Diagram?
Conceptualized by Johan Venn, these diagrams are used to depict the relationship between two entities. The questions based on this concept usually symbolize data or elements via geometrical figures like – circles, triangles, rectangles and squares, wherein the circle is the widely used representation.
Understanding Venn diagram through an example:
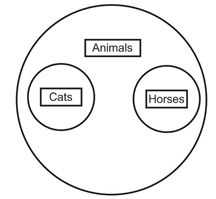
Illustrating Cats, Animals and Horses:
a) We know that ‘cats’ are ‘animals’; hence ‘cats’ are a subset of ‘animal’. This means the circle representing ‘cats’ will be inside the circle representing an animal.
b) Similarly, ‘horses’ are also ‘animals’, which me and the ‘horses’ are also a subset of ‘animals’ and hence the circle representing the ‘horses’ must also be inside the circle representing ‘animals.’
The pictorial representation of this would be:
Typically, two types of Venn-Diagram questions are asked in Bank and SSC exams:
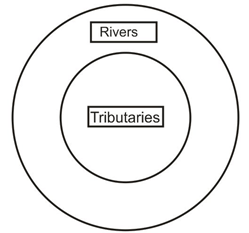
1) Establishing relationship among 2 or more elements: In order to get the right solution for these kinds of questions, it is important to have an understanding of the common relationships. Questions asked in SSC exams generally aim at evaluating the general awareness and analytical skills of the candidates. Here, the need is to link the given entities and if possible, draw a relationship. Let’s explain this further with an example: Let us derive a relationship between ‘Rivers’ and ‘Tributaries,’ we must know the fact that ‘Tributary’ is a small river meeting the big river, which means all ‘Tributaries’ merge in to ‘Rivers’ and that ‘Tributaries’ are a part of ‘Rivers.’
Pictorial representation for this would be:
Following are the major types of relations, established through Venn-Diagrams:
a) Not all elements are related, e.g. three entities- boys, elephants and plants belong to three different groups and thus are not related.
b) For three or more elements in a group, the first element is related to the second and the second is related to the third and so on e.g. ships, sailors and oceans are three related entities.
c) Two elements can be the subset of the third element e.g. ‘Lilies’ and ‘Roses’ are subsets of ‘Flowers’, which is the main set.
d) It is possible that two elements (first and second) are not related to each other but are related to the third element e.g. ‘girls’ and ‘boys’ are not related but are somehow related to ‘doctors.’
e) Again, it is possible that in a group, two elements are related to each other but are not related to the third element e.g., ‘trees’ and ‘leaves’ are related but are different from the third element, which is the ‘sky’.
2) Concluding the exact region: There are a group of questions wherein the candidate has to identify the region through data analysis and deductions. Based on this a question was asked in SSC FCI Combined Assistant Grade-III exam held in the year 2012,which is as follows:
a) Which number in the following Venn-Diagram signifies homemakers among women who are good at crafts?
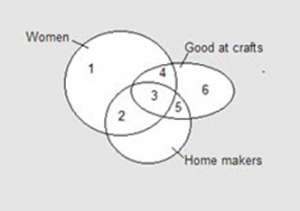
Ans: The three entities in this question are: Women, Homemakers and good at crafts. The region which represents all these three entities is region no.
b) Tell the alphabet which denotes the graduates who know cooking and who are not working?
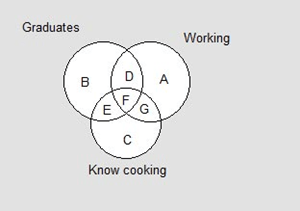
Ans: The alphabet ‘E’ is the answer.
We hope these few examples should help you get an idea about how to solve the Venn-Diagram. For a detailed understanding of the concept feel free to visit our website http://online.vidyaguru.in/ssc-coaching/ and get enrolled for our SSC/Banking online course.